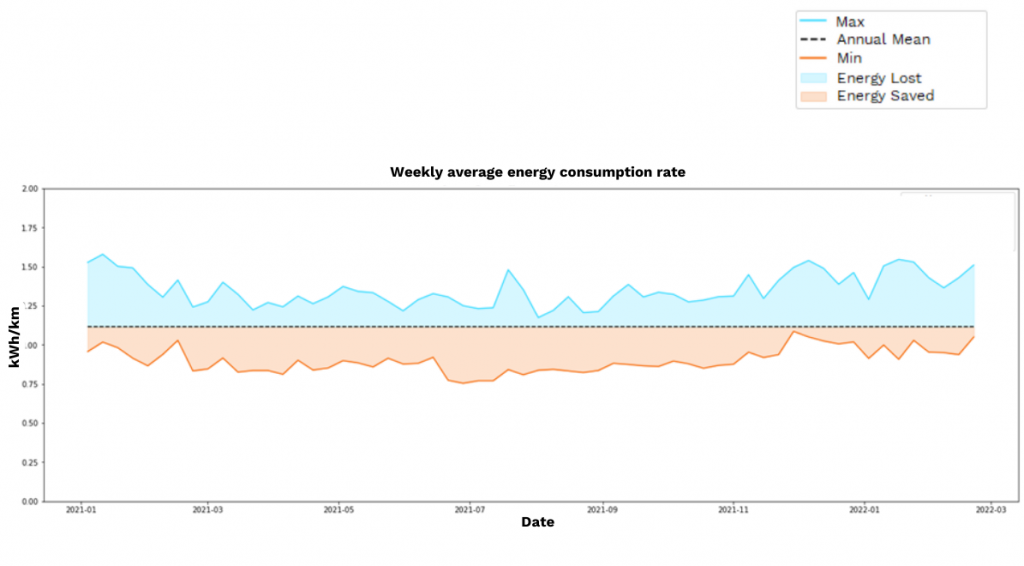
Looking at anonymised driver data from our proprietary software, we worked out that the average energy consumption across all the services in a depot over a period of 14 months was 1.11 kWh/km. Maximum consumption averaged 1.35 kWh/km and minimum energy consumption averaged 0.89 kWh/km. By ‘consumption’ we mean the net amount of energy used on the road, per km.
Therefore, the most inefficient drivers use c. 0.24 kWh/km above the average and the most efficient drivers use c.0.22 kWh/km below the average. If you assume energy costs of £0.15/kWh, energy losses of 85% from grid to vehicle battery, and a mileage of 200km/day, 6 days a week, then the difference in electricity costs are £5k per bus per year. In the current energy crisis, this is definitely not something to ignore!
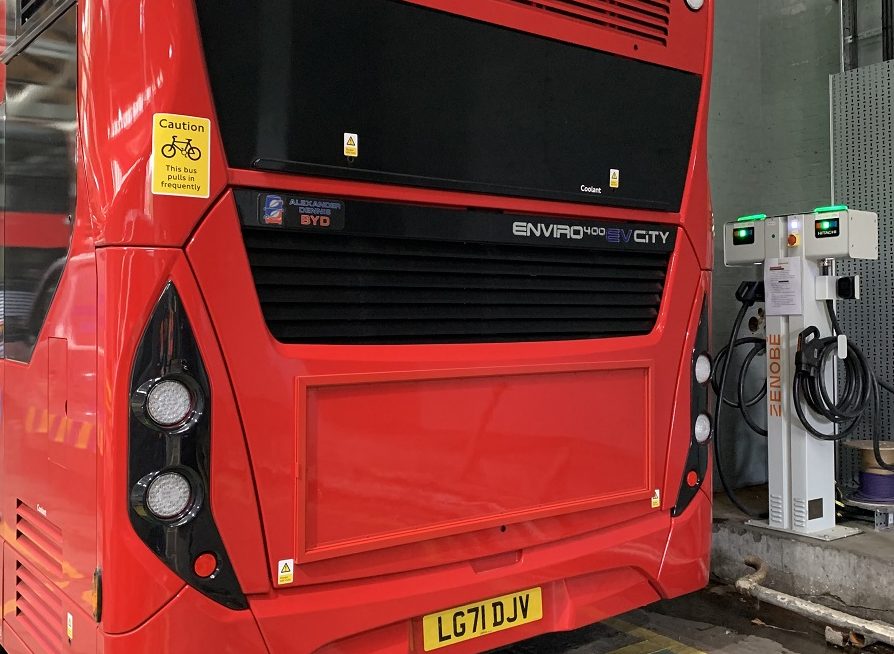
There are a number of ways in which a driver can influence the energy efficiency of an electric bus but perhaps the most significant is the way in which they slow the bus down. Electric buses (and other electric vehicles) have regenerative braking systems where easing the accelerator to slow down (instead of using the brakes) generates energy that is then stored in the battery. This is known as ‘regenerative braking’ and has two functions:
If a driver uses the brakes rather than easing the accelerator, they will have a higher energy consumption rate.
Get the latest insights on how energy and transport sectors are moving to net zero.

Pete leads Zenobē’s growing team of Product specialists across all areas of the business. His team oversee our R&D as well as product development in both hardware and software.
He has been working in the European E-Mobility sector from over ten years, specialising in the design, build and delivery of software systems for EV Charging.